AWS Lambda with Splunk HEC
AWS Lambda with Splunk HEC is a well known infrastructure pattern for streaming all sorts of data into Splunk. This guide sets up the AWS Lambda function and an Splunk HEC input.
Background
Streaming Cloudwatch Logs into Splunk is a common requirement. Instead of polling and pulling data down from AWS, AWS Lambda can stream data into Splunk in near real-time as events are generated. This is seen as a more efficient approach.
The Add-on for AWS is a popular way to retrieve Cloudwatch logs, however, beware there is a hardcoded delay of 4 minutes to account for latency on the AWS side. In practice, even with the most aggressive polling frequency we have seen this translate to about 6 minutes between ingestion. Using AWS Lambda with Splunk HEC overcomes this.
Our Lambda function will be placed in a private subnet and access Cloudwatch Logs via the public internet.
So here are some pre-requisites before we move on.
- NAT Gateway or NAT instance in a 'public' subnet in the local VPC. The term public here refers to being able to send traffic out over the internet to access the Cloudwatch API.
- Subnet for the lambda function to reside in.
- Route table attached to the subnet that has a default route to the NAT. Note that AWS networking does not allow subnet routing to use a NAT in a peered VPC.
- Splunk Enterprise with HEC enabled. If it is in another subnet, ensure that it is routable from the subnet where the Lambda function resides in.
Adding a new HEC Input
Generate a new HEC input and token. Use the new HTTP input wizard in the Splunk web console on the API collector to initially create the new input including token. Then edit the the inputs.conf to specify the index if it does not exist on the API Collector instance.
[http://myapp_api_gateway_log]
description = MyApp API Gateway logs from Cloudwatch
disabled = 0
token = <new GUID>
index = myapp
indexes =
source =
sourcetype = aws:apigateway:executionlog
sourcetypeSelection = Manual
AWS Lambda
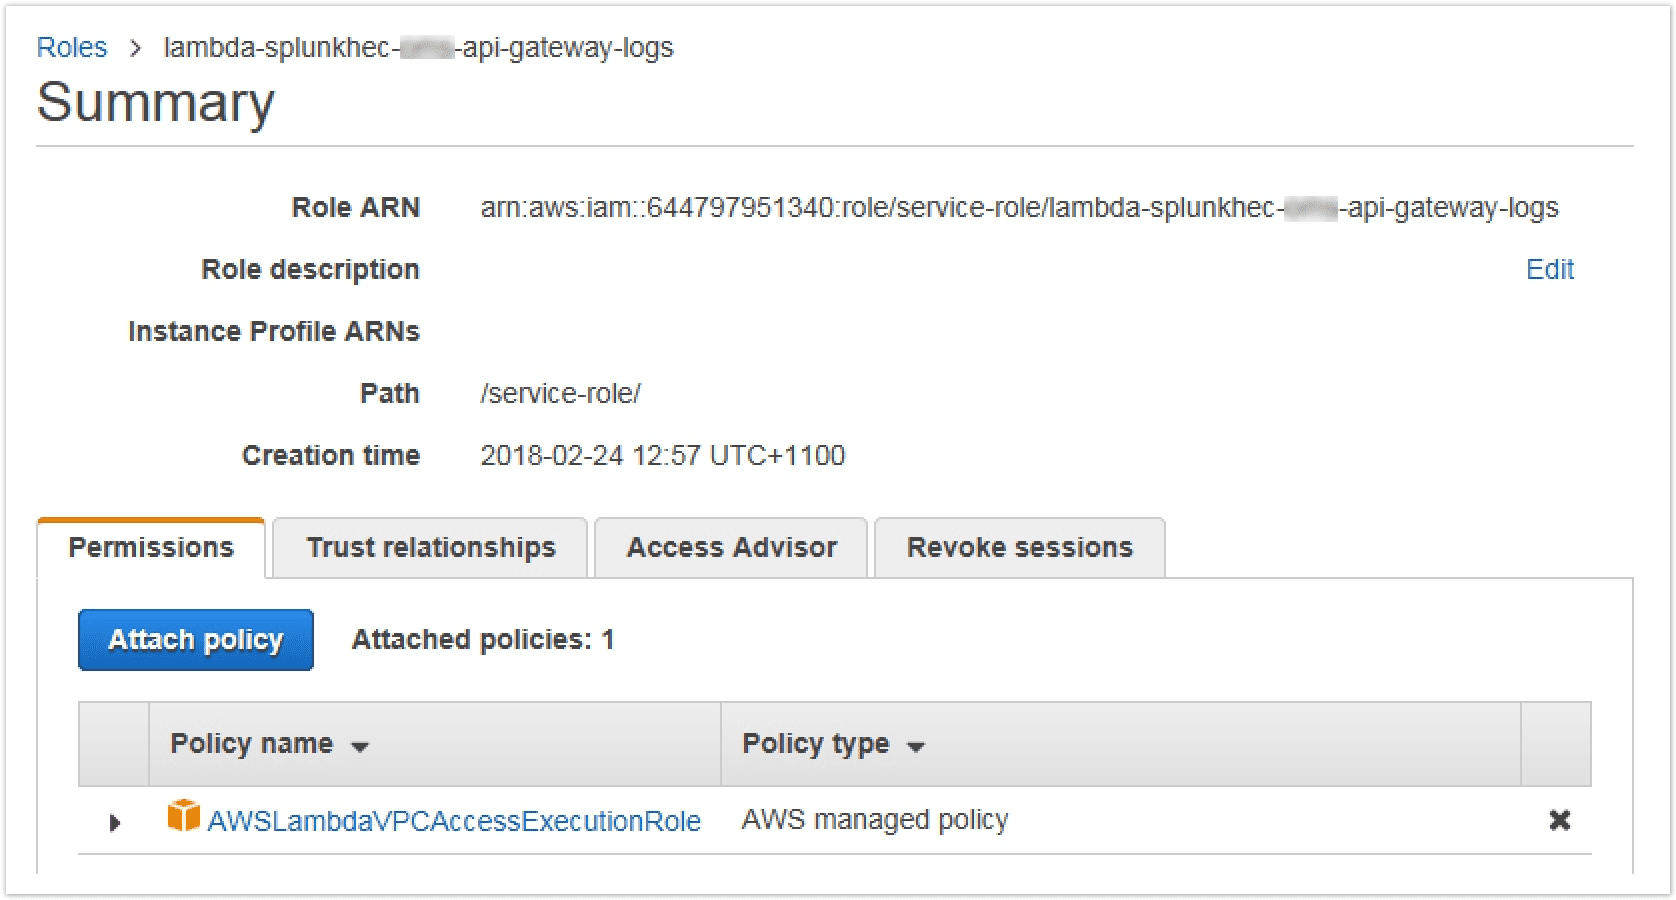
Before creating the Lambda function, create an IAM role dedicated to the function.
IAM Role
Create a new IAM role with the below policy and trust relationship. This allows Lambda to create its own execution logs in Cloudwatch and to manage ENI's in the VPC to access local VPC resources
Now edit the trust

Lambda Function
-
Now we can create the actual Lambda function. Use the Splunk Cloudwatch Logger blueprint
-
Add the CloudWatch Log Groups that will trigger this function
-
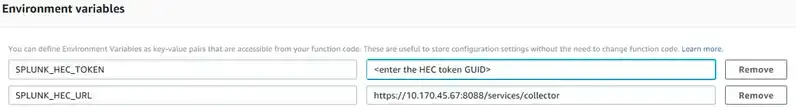
Fill out the required environment variables. Note we are using the private IP to our Splunk HEC service
-
Configure the network access. Despite the red warning about the 2nd subnet, we can still create the function using a single subnet.

-
Configure the IAM role that the function will use during execution

-
We want to set the source per event so users will see the Cloudwatch log stream name as the event source. otherwise it will be set to Lalmbda name.
Edit the function code to override the source key in the JSON object (line 28).
exports.handler = (event, context, callback) => {
  //console.log('Received event:', JSON.stringify(event, null, 2));

  // CloudWatch Logs data is base64 encoded so decode here
  const payload = new Buffer(event.awslogs.data, 'base64')
  // CloudWatch Logs are gzip compressed so expand here
  zlib.gunzip(payload, (err, result) => {
    if (err) {
      callback(err)
    } else {
      const parsed = JSON.parse(result.toString('ascii'))
      //console.log('Decoded payload:', JSON.stringify(parsed, null, 2));
      let count = 0
      if (parsed.logEvents) {
        parsed.logEvents.forEach(item => {
          /* Log event to Splunk with explicit event timestamp.
                        - Use optional 'context' argument to send Lambda metadata e.g. awsRequestId, functionName.
                        - Change "item.timestamp" below if time is specified in another field in the event.
                        - Change to "logger.log(item.message, context)" if no time field is present in event. */
          //logger.logWithTime(item.timestamp, item.message, context);

          /* Alternatively, UNCOMMENT logger call below if you want to override Splunk input settings */
          /* Log event to Splunk with any combination of explicit timestamp, index, source, sourcetype, and host.
                        - Complete list of input settings available at http://docs.splunk.com/Documentation/Splunk/latest/RESTREF/RESTinput#services.2Fcollector */
          logger.logEvent({
            time: new Date(item.timestamp).getTime() / 1000,
            event: item.message,
            source: parsed.logGroup,
            //host: 'serverless',
            //sourcetype: 'httpevent',
            //index: process.env.INDEX,
          })

          count += 1
        })
      }

      // Send all the events in a single batch to Splunk
      logger.flushAsync((error, response) => {
        if (error) {
          callback(error)
        } else {
          console.log(`Response from Splunk:\n${response}`)
          console.log(`Successfully processed ${count} log event(s).`)
          callback(null, count) // Return number of log events
        }
      })
    }
  })
}